How do you measure a field like electrical or magnetic fields? The field itself is of course not visible. But you can see the effects of a field and use that for the visualization. For example, in case of magnetic fields a nice high school type of experiment is to use iron filings sprayed around a magnet. The filings align along the field lines (so that the force on them is minimum), and this alignment makes the field lines visible.

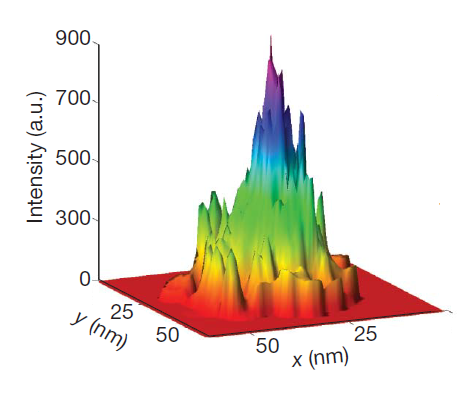
The electromagnetic fields of a hot spot on the surface of aluminium. The hotspot is only a few nanometres in size. (c) Nature Publishing Group. Nature 469, 385-389 (2011).
Although this kind of visualization technique works very well for larger objects, things get trickier if the fields are concentrated within the tiniest spots only a few nanometers large. There aren’t many objects that could be used to measure fields on that scale. Yet Xiang Zhang and colleagues from the University of Berkeley have achieved exactly that and developed a method capable of measuring the electromagnetic fields down to an area only 15 nanometres in size.
The fields they measure are so-called hotspots that form at the surface of metals or around metallic nanostructures such as nanoparticles or nanoscale bow tie structures. There, collective movements of the electrons – the surface plasmons – can create huge electromagnetic fields. This is very much in analogy to the way any other antenna works: oscillating electrical currents create electromagnetic radio waves. On the surface of metal nanostructures, the same happens; but because the geometry is so small the effect is much larger.
These hotspots are very efficient antennas indeed. Light that is directed on the hotspot with a frequency close to the resonance of these plasmons is very tightly focussed into this tiny space. If a molecule happens to be in that hotspot, the interaction with this highly concentrated light is very strong. It is no surprise that this effect is explored for sensing applications such as surface-enhanced Raman spectroscopy (SERS).
The efficiency of SERS and other applications, however, depends on the precise distribution of electromagnetic fields at these hotspots. It is a somewhat surprising drawback that the electromagnetic field of these hotspots couldn’t be measured so far. In their experiments, Xiang Zhang now use the ultimate analogue to iron filings to visualize the electromagnetic field of hotspots: single molecules. They take a dilute solution of dye molecules and pour this on the hot spots. Then, they turn the light on. Due to the antenna effect of the plasmons the light gets focussed into the hotspot, where it excites the dye molecules and causes them to emit light. But the dye molecules can only emit light for a little while before their electronic states become saturated. Each dye molecule only sends out a brief flash of light before it goes dark again for a certain period of time.
The researchers then made sure that the dye solution is so dilute that on average only one molecule at a time emits a flash, which they are able to measure with an accuracy of 1.2 nanometres. Furthermore, due to the random movement of the dye molecules, the flash from the dye molecules always occurs at a different location. The intensity of the light emission of the molecule, however, is the same all the time. But the light intensity the camera sees depends strongly on the antenna effect of the hotspot, which in turn depends on the local electromagnetic field at the position of the dye molecule. In that way the location and intensity of the light flashes from the dye molecules provides a direct map of the electromagnetic fields in the hotspot – with nanometer resolution.
At the moment, the technique only is able to measure two-dimensional images of the hotspots, but three-dimensional sensing seems not too unlikely. Nevertheless, already at this stage this tool provides very useful feedback for the study of hotspots and the further development of applications such as SERS.
Reference:
Cang, H., Labno, A., Lu, C., Yin, X., Liu, M., Gladden, C., Liu, Y., & Zhang, X. (2011). Probing the electromagnetic field of a 15-nanometre hotspot by single molecule imaging Nature, 469 (7330), 385-388 DOI: 10.1038/nature09698


January 23, 2011 at 00:25
Hi Joerg – you might find this paper to be interesting as well: Ward et al., Nature Nano. 5, 732 (2010). http://www.nature.com/nnano/journal/v5/n10/full/nnano.2010.176.html
Cheers
Doug